I’ve been raised on Rabbie Burns poetry, bagpipes, kilts, Hogmanay, Irn-Bru and Celtic superstitions. Never leave by a door you didn’t come in by. Ye canna sit at a corner of a table. Bouquets are never made up of red and white flowers. This last one has caused a couple of conflicts in my own home. My husband is first generation American of Polish descent. Everything is done in red and white. But one holds fast to the old traditions when the Celtic blood runs strong and true through your veins.
But does it?
Ethnicity
We have all seen the commercials on TV. The happy lady standing next to her Pueblo pottery surprised by her 26% Native American. Just as often I’ve read posts on various Facebook groups by others who were disenchanted by ethnicity results that failed to show results that were expected. This week I had a frantic email from a cousin of my father’s. I had tested his DNA as part of a project of my own. For fun, he followed up by testing his wife’s DNA. Unfortunately, the elderly couple were understandably upset when the ethnicity results failed to identify any Scandinavian ethnicity. Her father was Danish.
Just as frequently are the concerns of variations in results from one testing company to another. There are a number of good blog posts about this subject. Roberta Estes does a particular good job explaining the shortcomings in current ethnicity testing in her blog here.
However, it was CeCe Moore that got me looking at the new-kid-on-the-block Living DNA, specifically for ethnicity results. Living DNA claims to give far greater detail to those with British Isles ancestry. My mother born in Scotland with Scottish parents, grandparents, great grandparents on back, with a few Irish and English touches here and there was ideal. What a great subject for me to test this claim. Plus, it would give me a scholarly excuse to order another DNA test, right?
Comparison Ancestry vs MyHeritage
After testing Mum in June the results have just come in from Living DNA. But before we explore them let’s review her Ancestry and MyHeritage ethnicity results. Both companies reporting Mum as 100% European. No surprises there.
| Ancestry.com Results | MyHeritage Results |
|---|---|
 |  |
The trace locations reported by Ancestry all make sense when considering the historical connection to the Celtic and Norse populations. The Europe West also make sense if one considers the genetic make-up of the Celts and their migration across Europe. All very interesting but not substantially useful for me. Does Living DNA live up to their standards of giving greater regional detail to those with British ancestry? And if so, is the information even accurate?
Living DNA
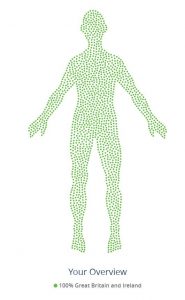
Well, Living DNA went so far as to indicate that Mum was not only 100% European, but 100% from Great Britain and Ireland. So far so good. As far as the paper trail has shown this is 100% accurate! Ok, it’s not much of a bench mark but its a great place to start. This is where now Living DNA claims to give detail down to the sub-regional level for your genetic ancestry in recent times. This is defined by Living DNA as 10 generations. Would it be able to illustrate my Mum’s ancestry on such a small geographic area?
Once again, Roberta Estes has a great blog post regarding percentages of DNA inherited by generation. Well worth a read if you need a little more help understanding the concept.
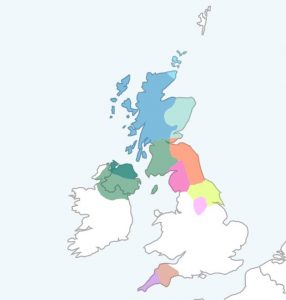
Living DNA provides an interactive map showing you the areas of the world your family is from back to about 1o generations. There are three options. Complete, Standard and Cautious. The cautious option groups similar areas of DNA together to give an overview of what areas the company is most confident assigning you to. There can be a large block of “unassigned” DNA. The standard highlights the most likely areas and groups a smaller segment of DNA as “unassigned.” The complete breaks down the unassigned elements into the most genetically similar areas. At the complete regional level Mum’s map looks like this.

Living DNA’s sub-regions
Still not excited. So let’s take that magical step and go to the sub-regional level, again at the complete option.
| Sub Region | Color | Percentage |
|---|---|---|
| Northumbria | Orange | 36.5% |
| Northwest Scotland | Dark Blue | 22.3% |
| Southwest Scotland and Northern Ireland | Green | 20.9% |
| Cumbria | Bright Pink | 11% |
| Orkney | Light Blue | 2.3% |
| Devon | Brown | 1.4% |
| Aberdeenshire | Pale Green | 1.4% |
| Cornwall | Purple | 1.4% |
| North Yorkshire | Yellow | 1.3% |
| South Yorkshire | Pale Pink | 1.3% |
Genetics vs Paper Trail
Ok that’s prettier, but how does this color blotched map hold up to the researched paper trail proved ancestry? Lets go back five generations (six if you count my mother as one) and look at what the potential DNA percentage could be inherited from each of her thirty-two 3x great-grandparents. If all things were equal and perfect, meaning Mum inherited exactly 5o% of the DNA from each of these thirty-two ancestors, she would have inherited 3.12% from each individual. Is there a correlation with the map above?
| Number of Individuals | Birth Place | Percentage of Potential DNA Inherited |
|---|---|---|
| 8 | Northern Ireland | 24.96% |
| 6 | Argyll (Northwest Scotland) | 18.72% |
| 6 | Dumfries/Kirkcudbright (Southwest Scotland) | 18.72% |
| 5 | Fife | 15.6% |
| 4 | Cumbria | 12.48% |
| 1 | Roxburgh | 3.12% |
| 1 | Lanarkshire | 3.12% |
| 1 | Renfrew | 3.12% |
With six 3x great grandparents with ancestry in Argyll the projected 22.3% by Living DNA for Northwest Scotland is pretty darn close. As is the 11% estimated ethnicity from Cumbria which with four 3x great grandparents rendering DNA would be 12.48%. However, things begin to crumble a little after that.
Eight such grandparents from Northern Ireland and six from the Southwest of Scotland, for a combined potential total of almost 44%, we’d expect the total for this region to be much higher than the projected 20.9%. So somehow the Northumbria DNA is way over-projected. Looking at Living DNA’s map, I am contributing the five ancestors from Fife with this contribution. The historic county of Fife, or former Kingdom of Fife, lies between the Firth of Tay and the Firth of Forth. Right where the above map joins the orange, dark blue and pale green. Therefore, the Northumbria contribution would likely be closer to the 15.6%. Even if we roll the last three grandparents in to this category from Renfrew, Lanark and Roxburgh, we do not get close to the estimate of 36.5%.
There is no known ancestors from Orkney, Devon, Aberdeenshire, Cornwall, or either Yorkshire. The low percentage suggests these are likely areas of similar DNA rather than a new area to set of researching for clues. Cornwall is closely related to the Celtic heritage similar to that of Northwest Scotland.
Refinement – the next step
Like all of the genetic DNA testing companies, Living DNA will continue to refine their reference populations and hopefully revise their algorithms allowing a more accurate projection. As a whole, I am happy with this starting place. I’ve talked about the party favor contribution of ethnicity results to genetic genealogy in the past. In fact, I am considering testing my father who 50% Swedish and 50% mix of Irish, British and German per his paper trail. [Update: Living DNA announced 8/23/2017 that they made some small changes to their algorithms which adjusted totals by about 1% for some individuals.]
So keep your shoes off my table. Bury a piece of that broken mirror in the garden. Clean the house before New Year, and make sure a dark-haired woman with something new in her hand walks through your door first in the New Year. All to keep the devil and evil spirits away. It’s in the blood. It’s there.